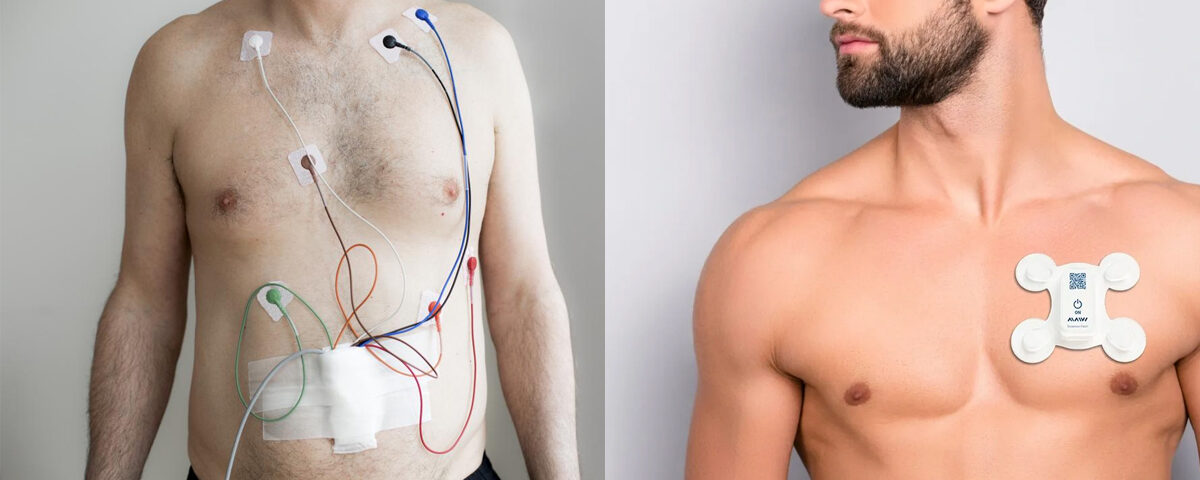
Holter monitoring is a continuous ambulatory electrocardiogram (ECG) recording performed over 24-48 hours (or longer) to detect irregular heart rhythms and other cardiac abnormalities that might not appear during a standard ECG.
Key Data Collected in Holter Monitoring:
1. Patient Information:
- Name
- Age
- Gender
- Date of test
- Duration of monitoring (e.g., 24 hours, 48 hours)
2. Heart Rate Data:
- Minimum heart rate (bpm)
- Maximum heart rate (bpm)
- Average heart rate (bpm)
3. Rhythm Analysis:
- Number and type of arrhythmias detected:
- Premature atrial contractions (PACs)
- Premature ventricular contractions (PVCs)
- Supraventricular tachycardia (SVT) episodes
- Ventricular tachycardia (VT) episodes
- Atrial fibrillation (AF) or flutter
- Episodes of bradycardia (slow heart rate)
- Episodes of tachycardia (fast heart rate)
- Pauses or asystole events (if any)
4. ST-Segment Analysis:
- ST elevation or depression episodes (indicating ischemia or infarction).
- Duration and severity of ST changes.
5. Symptoms Correlation:
- Symptom diary (correlation between recorded symptoms like dizziness or palpitations and arrhythmias detected).
- Event markers (indicating times when the patient felt symptoms).
6. Overall Summary:
- Total beats recorded
- Total time of recording
- Key findings (e.g., no significant arrhythmias, abnormal rhythm detected, frequent PVCs).
7. Diagnosis and Recommendations:
- Normal or abnormal findings.
- Suggested follow-up or treatment (e.g., medication, further tests, pacemaker evaluation).
How Data Might Be Extracted:
If extracting data from Holter monitoring reports:
- Structured format: Table with columns for heart rate statistics, arrhythmia counts, symptoms, and findings.
- Event-based details: Listings for each abnormal event with timestamps (e.g., “PVC detected at 10:45 AM”).
If you need help processing or organizing Holter data for analysis or presentation, let me know how you’d like the data formatted!


